At the beginning of the year, I had never vibe coded. Shocking, eh? So I felt I really needed to learn it. I knew it involved AI, and I loved AI, so that was good. I was also an experienced programmer — so that was good too. This story is about the coding process because mostly I’ve been talking about the AI Observatory that I’m building. I considered writing a high-level piece on verification processes, but let’s be honest: nothing brings developers together quite like the collective trauma of diagnosing distributed system bugs. Hence this…
Now there’s a particular class of bug that only exists in distributed systems: the one where everything works in isolation and nothing works together. My AI Observatory can operate on one machine or several — a deliberate design by me as I didn’t have the money to buy a really high-powered beast but did have lots of old PCs laying around my home.
Before I really knew what I wanted my AI Observatory to do, I decided that I wanted a mini-dashboard on it that would tell me the health of each of its component machines. I decided to use Grafana and Prometheus for this. So right at the beginning I installed a node-exporter on each of my machines to report CPU, RAM, and disk usage. Prometheus on the primary server would subsequently “scrape” it. And all was working well for a couple of months, during which the dashboard evolved into what was the Observatory’s System Vitals panel.
Then, one day, after having just introduced a model fragility probe and tested it, the “BackOffice” machine stopped reporting its vitals. This was… is a Windows box running Docker Model Runner with a 16GB VRAM GPU.
The symptom
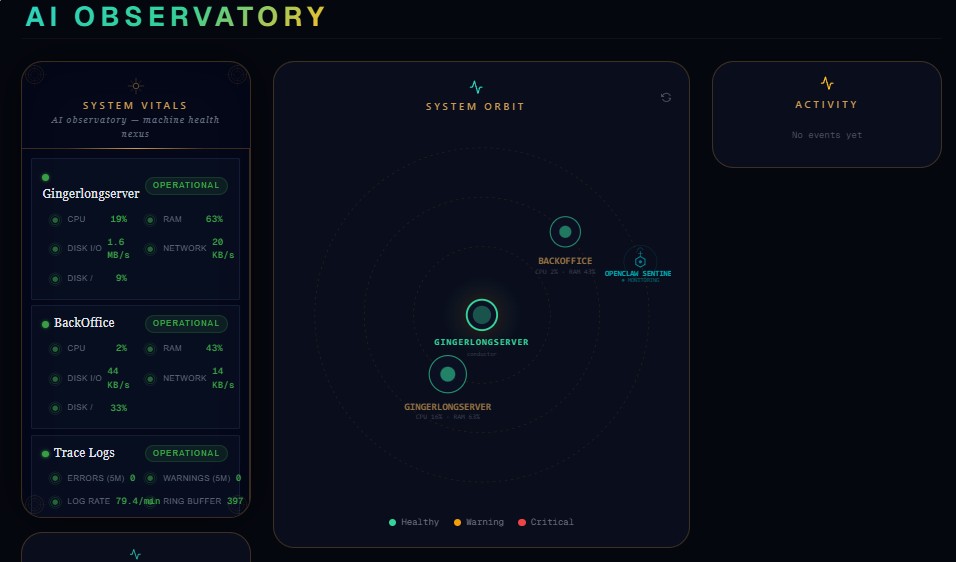
The System Vitals panel on the Systems tab showed three machines: Primary Server (healthy, green bars, real numbers), BackOffice (status: “unavailable”, all vitals showing em-dash), and Trace Logs (healthy). The BackOffice entry was a ghost — present in the config, listed in the UI, but carrying no data.
“Unavailable” in the vitals code means something specific that we had coded in the module`vitals.py:225`:
```python
is_remote = not prom_ok and mid != LOCAL_HOSTNAME and info.get("host", "") not in ("127.0.0.1", "localhost", "")
When `prom_ok` is `False` (Prometheus unreachable), every non-local machine gets stubbed vitals — the “unavailable” shell with no real numbers. The machine exists but its body is missing.
So the question was: why was Prometheus unreachable?
The dependency chain
We (meaning OpenCode and I) traced the chain link by link, and each link had its own failure mode.
Link 1: Prometheus was disabled
The `network.json` config had `prometheus.enabled: false`. The service was defined (host `127.0.0.1`, port 9090) but marked as disabled. `config_manager.service_url(“prometheus”)` returns `””` when `enabled` is false, so `get_prometheus_url()` returned an empty string, and `prom_ok` was `False` before any network call was made.
Fix: set `enabled: true` and `host: “127.0.0.1”` (it had been set to `0.0.0.0` — Prometheus itself binds to 0.0.0.0, but the Observatory queries it via localhost).
Link 2: node_exporter was inside WSL
The BackOffice runs Windows with Docker Desktop. Inside WSL, a `prometheus-node` process (pid 183) was running on port 9100. But WSL networking doesn’t automatically bridge to the host LAN. From the primary server, `curl http://192.168.0.187:9100` timed out — the port wasn’t reachable from outside.
Fix: a Windows port proxy rule:
```powershell
netsh interface portproxy add v4tov4 listenport=9100 listenaddress=0.0.0.0 connectport=9100 connectaddress=127.0.0.1
This tells Windows to accept connections on all interfaces (including the LAN IP) and forward them to the WSL port. The `0.0.0.0` listen address covers both LAN and Tailscale IPs.
Link 3: The firewall
Even with the portproxy in place, Windows Firewall blocked inbound connections on port 9100. I added firewall rules and tested — but the first attempt still timed out. The portproxy rule had vanished. These rules are not durable across WSL restarts or Docker Desktop reboots. I re-created them.
Fix: firewall rules allowing inbound TCP on port 9100, plus awareness that portproxy rules are ephemeral.
Link 4: No scrape target
Prometheus was running and scraping `localhost:9100` (the primary server’s own node_exporter), but had no configuration to scrape the BackOffice. Without a scrape target, Prometheus never asked for the data, even though the port was now reachable.
Fix: add a `backoffice` job to `/etc/prometheus/prometheus.yml`:
```yaml
- job_name: backoffice
  static_configs:
- targets: ["192.168.0.187:9100"]
Then signal Prometheus to reload: `kill -HUP $(pidof prometheus)`.
After this step, `curl http://127.0.0.1:9090/api/v1/targets` showed:
backoffice 192.168.0.187:9100 up
node localhost:9100 up
prometheus localhost:9090 up
All three targets healthy. Prometheus was scraping BackOffice. Time to celebrate?
Not yet.
Link 5: The stale circuit breaker
The vitals endpoint still returned “unavailable” for BackOffice. Prometheus was up, scraping both machines, returning real data. But the Observatory backend — the FastAPI process running since the previous day — was still stuck in “Prometheus unreachable” mode.
Here’s what happened. The backend process had started on Tuesday at 09:10 UTC. At that point, Prometheus was disabled in the config. The first time `collect_vitals()` ran, it called `_prom_reachable()` which tried to reach Prometheus, failed (because the URL was empty or the service was marked disabled), set `_PROM_DEADLINE = now + 30`, and returned `False`. The `is_remote` flag kicked in, and BackOffice got stubbed vitals.
Thirty seconds later, the deadline expired, and `_prom_reachable()` would retry. But here’s the subtle part: even after we enabled Prometheus in the config, the running process had been started with Prometheus disabled. Huh?
The `config_manager` reads the file dynamically, so the URL was now available. But the `_PROM_DEADLINE` global was still in its module-level state — `0.0` initially, updated on failure, expiring after 30s. In theory, after the first 30s window expired, the next call should succeed.
But it didn’t. The circuit breaker’s interaction with the query cache (`_PROMQL_CACHE`) and the module-level state created a situation where the backend never cleanly retried after the config change. The process had a memory of Prometheus being unreachable, and that memory outlived the fix.
The only fix: restart the backend.
```bash

systemctl --user restart mythic-conductor
Three seconds later:
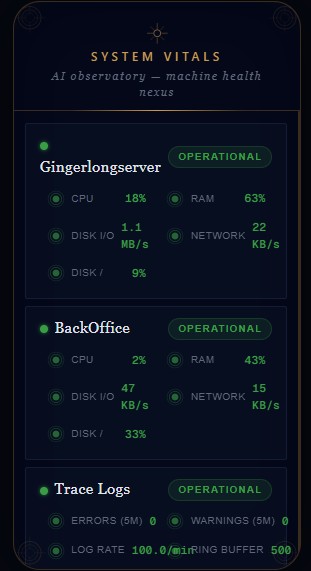
Real numbers, live from the GPU machine, flowing through Prometheus into the Observatory’s vitals panel.
The debugging topology
Here’s what was unusual about this debugging session: it required coordinated action across three machines, with me as the bridge between two of them.
Machine 1: gingerlongserver (the primary server). The OpenCode instance running here could modify `network.json`, edit `prometheus.yml` (with sudo from me the user), query Prometheus’s API, restart the backend service, and verify results via `curl`. OpenCode had full access to the Observatory’s codebase and could trace the exact code path from `collect_vitals()` through `_prom_reachable()` to the `is_remote` flag.
Machine 2: BackOffice (the Windows GPU machine). Another OpenCode instance operated here, but the portproxy and firewall rules required PowerShell commands running as Administrator on the Windows host — outside WSL, outside the scope of the Linux-based agent. I had to physically type those commands on the BackOffice keyboard. OpenCode could diagnose the problem from gingerlongserver (the `curl` timeout told me the port was unreachable), but I had to jump between computers.
It was apparent that I, the human, was the bridge. I ran `netsh` commands on BackOffice’s PowerShell while I tested connectivity from gingerlongserver with `curl`. I re-created the portproxy rule when it vanished. I added firewall rules. Each action was prompted by a diagnosis made on a different machine.
This is the reality of debugging distributed systems: the person with the keyboard is a significant participant, not an observer. The AI instances can read code, trace data flows, and formulate hypotheses. But when the fix requires `Administrator` privileges on a Windows machine that only the human can reach, the human is part of the debugging loop.
What we learned
Adding a remote machine to System Vitals is not a one-line config change. It’s five steps, all of which must be true simultaneously:
- `prometheus.enabled: true` in `network.json`
- `node_exporter` running on the remote machine, bridged to the LAN
- Firewall allowing inbound TCP on port 9100
- Scrape target in `prometheus.yml`
- Backend restarted after step 1
Missing any step produces “unavailable.” The most common miss is step 5 — enabling Prometheus in the config without restarting the backend.
We also learned about the Circuit breaker stale state: Module-level globals that cache external-service state are a known pattern for performance. But they have a failure mode that config-driven systems don’t anticipate: the global can latch a “service unreachable” state that persists across config changes. The `_PROM_DEADLINE` in `vitals.py` works perfectly for transient failures (network blip, Prometheus restart). It fails silently when the config changes while the process runs.
The right fix is to invalidate the deadline when the Prometheus URL changes:
```python

# In collect_vitals():

if prometheus_url != _last_prom_url:

    _PROM_DEADLINE = 0.0  # reset breaker on config change

    _last_prom_url = prometheus_url
Until that fix is in, the workaround is a backend restart after enabling Prometheus.
We also learned that the WSL portproxy is not durable. `netsh interface portproxy` rules survive reboots of the Windows host but vanish on WSL restart or Docker Desktop restart. For a development machine where Docker Desktop might be restarted frequently, this means either:
- A startup script that re-applies the rules
- A Windows scheduled task that runs on WSL startup
- Running node_exporter directly on the Windows host (outside WSL)
The portproxy approach works, but it’s fragile. Know that it’s fragile.
Another lesson was that Prometheus shows `up` but the app shows `unavailable`
This was the most confusing part. We verified Prometheus was scraping BackOffice (`curl http://127.0.0.1:9090/api/v1/targets` showed `backoffice 192.168.0.187:9100 up`). We verified the CPU query returned real data (`cpu_map` had `192.168.0.187:9100: 14.98`). But the vitals endpoint still returned “unavailable.”
The disconnect was in the backend process state. Prometheus was healthy. The data was there. But the backend’s internal circuit breaker said “Prometheus is unreachable” and never retried properly. The data flowed from BackOffice → node_exporter → Prometheus, and then hit a wall at the backend’s `_prom_reachable()` check.
When debugging distributed systems, verify each link independently. The data path has multiple hops, and a “no data” symptom at the UI layer could mean any link is broken — or in this case, that the data is flowing but the consumer has a stale memory of the producer being down.
Conclusion
To diagnose and fix the problem, it took:
- two machines with their own instances of OpenCode to rapidly read, write and test code,
- an online instance of Google Gemini (to research and verify ideas), and
- one human (me) to coordinate everything and type in code or passwords as required.
But I found, as a programmer, that AI really sped up what I could do. In 2000, I had been part of a great programming team that worked well together. I found that this group of AI’s provided the same experience.